User guide
Available CLI programs:
- panther format conversion, calculation of harmonic and anharmonic frequencies
- plotmode visualiztion of vibrational potential per mode
- writemodes conversion of geometry files to collections of modes
panther
The panther script takes two command line argument
$ panther

usage: panther [-h] {convert,harmonic,anharmonic} config

positional arguments:
  {convert,harmonic,anharmonic}
                        choose what to do
  config                file with the configuration parameters for thermo

optional arguments:
  -h, --help            show this help message and exit
The input file is in the standard condif file format and contains three sections
conditions, job and system defining the parameters.
conditions
- pressure : float
- Pressure in MPa
- Tinitial : float
- Smallest Temperature in K
- Tfinal : float
- Largest temperatue in K
- Tstep : float
- Temperature step for temperature grid (in K)
[conditions]
Tinitial = 303.15
Tfinal = 403.15
Tstep = 10.0
pressure = 0.1
job
- translations : bool
- If True the translational degrees of freedom will be projected out from the hessian
- rotations : bool
- If True the translational degrees of freedom will be projected out from the hessian
- code : str
- Program to use for single point calcualtions
[job]
translations = true
rotations = false
code = vasp
system
- pointgroup : str
- Point group symbol of the system
- phase : str
- Phase of the system, either
gasorsolid
[system]
pointgroup = Dooh
phase = gas
plotmode
$ plotmode -h

usage: plotmode [-h] [-s SIXTH] [-f FOURTH] [-p PES] [-o OUTPUT] mode

positional arguments:
  mode                  number of the mode to be printed

optional arguments:
  -h, --help            show this help message and exit
  -s SIXTH, --sixth SIXTH
                        file with sixth order polynomial fit,
                        default="em_freq"
  -f FOURTH, --fourth FOURTH
                        file with fourth order polynomial fit,
                        default="em_freq_4th"
  -p PES, --pes PES     file with the potential energy surface (PES),
                        default="test_anharm"
  -o OUTPUT, --output OUTPUT
                        name of the output file
Example
Provided that the default files em_freq, em_freq_4th and test_anharm are present
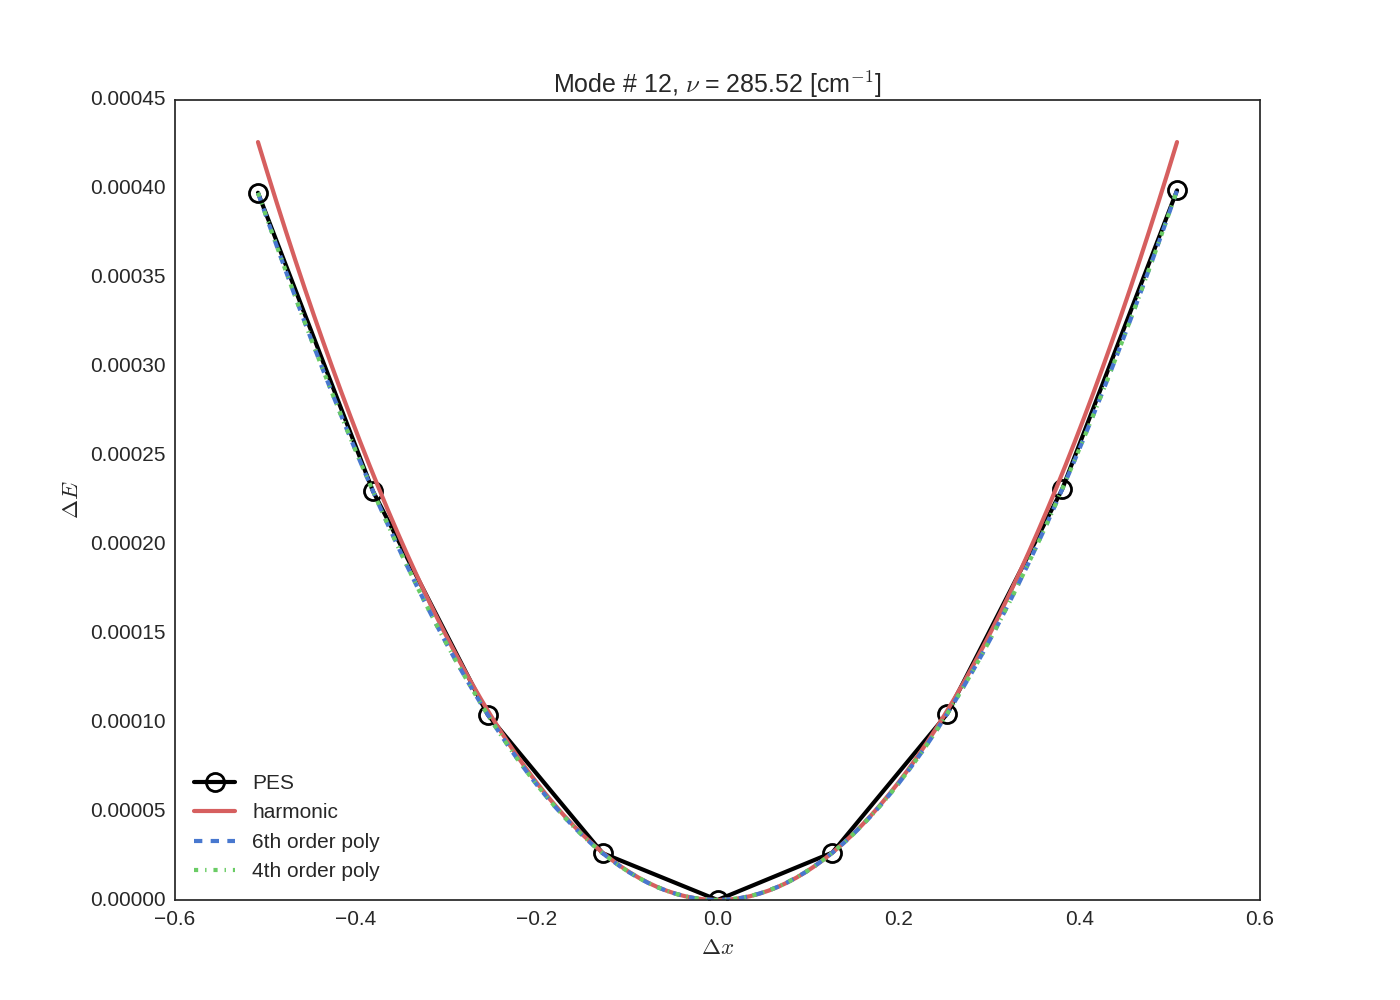
to plot the last mode only requires the argument 12
plotmode 12

writemodes
This program takes the single file with continuous geometries in VASP POSCAR format as input and writes separate file in ASE trajectory format per node to a specified directory.
$ writemodes -h

usage: writemodes [-h] [-d DIR] filename

positional arguments:
  filename           name of the file with geometries, default="POSCARs"

optional arguments:
  -h, --help         show this help message and exit
  -d DIR, --dir DIR  directory to put the modes, default="modes"
Example
Provided that the POSCARs file exists we can generate trajectory files with the modes with:
writemodes POSCARs
which produces the mode.X.traj files in the modes directory where X is the mode number.
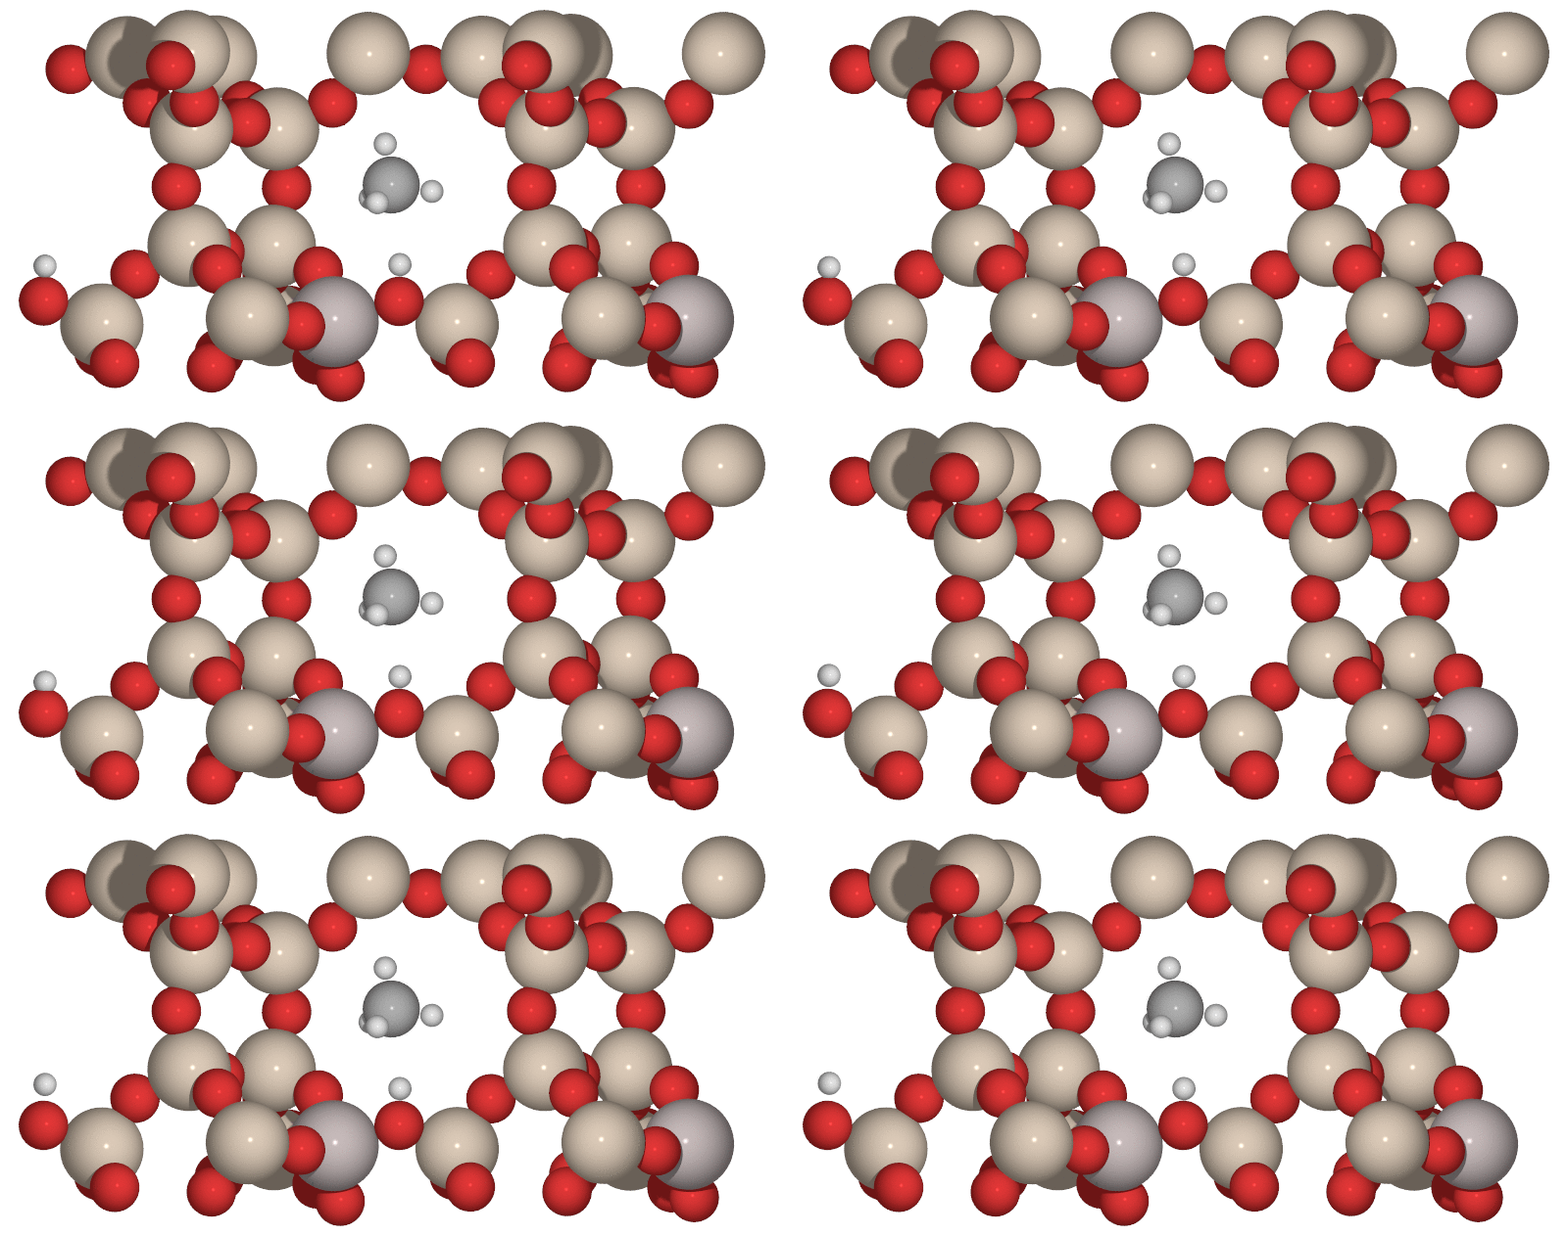
We can now generate a set of PNG files representing the snapshots of the mode by:
from ase.io import read, write
modes = read('mode.1.traj', index=':')

for i, mode in enumerate(modes):
    write('{0:0>3d}.pov'.format(i), mode, run_povray=True, rotation='90x', canvas_width=800)
To see the animation we can create an GIF file from the previosly generated PNG files using
the convert program from the ImageMagick package:
convert -delay 15 -loop 0 *.png mode1-animation.gif
